


The Black Arts of Hakeem the Dream in the Post-season
When I saw Hakeem Olajuwon’s playoff success, I assumed his complex post-game — full of counters — was the driving factor as his offensive game suffered little against better defenses. Coupled with Houston’s cadre of shooters around him, and Olajuwon was free to put players in his torture chamber.
However, from the analysis from the last article, this wasn’t the case: Olajuwon’s marginal decrease in efficiency as defenses get better is nearly average over his prime seasons (1986 to 1997.) Playoff results are born out of noise small sample sizes, influenced by random outcomes like injured players or upsets, so it’s difficult to prove a player is truly “better.”
But Olajuwon’s the exception. This is pretty straightforward to test. With a variable for the strength of the opposing defense, you can add a dummy variable for playoff games. There are other factors at play here, of course, but with a sufficiently long career it’s a decent method.*
*A note on the methodology: the dependent variable is his efficiency relative to his regular season efficiency from that corresponding season. This was needed to ensure results not influenced by having a disproportionate amount of playoff games at different points in his career.*
Take Shaquille O’Neal for example. He’s known for pulverizing opponents on the way to titles, but let’s see if his efficiency was significantly different in the playoffs. From 1994 to 2005, taking into account opposing defenses, playoffs were not a significant factor (the p-value was 72%, and for those unfamiliar with statistics anything below 5% is in the realm of significance, so 72% suggests no relationship at all.) Even if you narrow the range to his best Laker seasons, his efficiency still is not appreciably different. Note that from the last article, usage changes are minor in most cases, as possessions will be used whether or not the opposing team is good.
Ewing is a more interesting case because his efficiency is more reliant on the level of the opposing defense. Ewing’s also infamous for his playoff embarrassments, notably the 1994 finals series where he shot an abysmal 39 TS% (from a 36 FG%.) Yet, like Shaq, there’s no statistical significance he was worse in the playoffs, as the p-value was 62%. Note that there is a 1 point drop in efficiency over his career in the playoffs, but according to the regression this is within the bounds of natural variance (i.e. it’s like getting seven tails out of ten when flipping a coin).
Olajuwon, meanwhile, is some sort of playoff demon.
Assuming a one-to-one relationship between his offensive efficiency and the opposing team’s defense, Olajuwon’s efficiency climbs by 6 points per 100 possessions in the playoffs using seasons 1986 to 1997. This figure is fairly consistent over the course of his career. To put this in perspective, in 1994 Olajuwon was 97th out of 230 in offensive efficiency in the regular season (minimum 200 minutes), and with his playoff increase that would put him near 25th by supreme shooters like Tim Lelger and Glen Rice.
Without the one-to-one relationship, the playoff increase is 6.2 points, but his opposing defense multiplier is 1.11. What’s that mean? Olajuwon loses more of his efficiency than you’d expect as defenses get better, but it’s by a small amount and his playoff increase is much larger. It’s a more complicated relationship, but he is indeed better versus high levels of competition in the playoffs.
David Robinson, however, is inconsistent in the playoffs and is on the border of statistical significant, in terms of playing under his own performance level. His efficiency drops by 3.9 points in the playoffs adjusting for strength of schedule, but the p-value is 7.4% as the standard error is 2.2. In basic terms, his efficiency does drop but there’s a lot of variation so there’s less certainty. Constraining his seasons to 1993 through 1996, his peak seasons pre-Tim Duncan, his efficiency drops by an incredible 7.0 points with a standard error of 3.0 and a p-value of 2.1%. This is a confirmation of past beliefs, but it’s better tested than the anecdotal evidence and raw stats.
But I will be quick to note the folly of deliberately selecting seasons to determine an outcome. If you add in the 1991 season (he missed the playoffs due to injury in 1992)*, the p-value increases to 5.0% and his playoff efficiency drop is 5.7 points. If you add 1990, however, the values change to 18.6% and 3.5, respectively. Robinson fell short during a two of his best seasons, 1994 and 1996, but he played well in the 1990 playoffs against a couple good defenses, Denver and Portland. He also torched Golden State in 1991, but that was an all-offense, no-defense Don Nelson team.
*In defense of Robinson, in 1992 without him his team was outscored by 9 points in three playoff games. Given how good Phoenix and San Antonio we during the regular season and on more game with homecourt, you’d expect Phoenix to outscore them by only 1.8 points per game, implying that Robinson is worth 7.2 points per game, which is gargantuan. This aligns with how terrible the team was without him in 1989 and 1997.*
Looking closer at his opponents in 1990, Robinson was matched up against Blair Rasmussen on Denver and the smaller Cliff Robinson on Portland, as their center, Kevin Duckworth, missed nearly the entirety of the series with an injury. Robinson excels versus softer defenses, and these were more favorable match-ups for him. Bridging the quantitative with the qualitative, Robinson didn’t have a refined game but relied on his athleticism with fast breaks, cuts/rolls to the rim, and drives. Smart defenses and defenders who can approximate his size and athleticism can take away those easier shots, and Robinson has to resort to his jump shot and his shakier post game.
Olajuwon, however, has advanced moves with counters and will pull off difficult fadeaways and up-and-unders in almost any situation. Better defenses can’t remove those shots too easily, especially with shooters around him. The conjecture about the game slowing down in the playoffs is exaggerated, but there is a small change and it would explain some of the difference between Robinson and Olajuwon in the playoffs.
Robinson’s stats typically look better than Olajuwon’s in the regular season and advanced metrics have trouble ranking Robinson accurately, as by some methods he’s a top four or five player ever. Olajuwon matches Robinson’s numbers fairly well except for efficiency (in the regular season.) Let’s use the estimates here to compare how they’d do versus a similar opponent.
Olajuwon versus -3 defense (very good), 1986 to 1997:
Regular season: 105.5 offensive rating
Playoffs: 111.7 offensive rating
Robinson versus -3 defense(very good), 1990 to 2001:
Regular season: 112.0 offensive rating
Playoffs: 108.1 offensive rating*
*Playoff coefficient was not strictly significant
Olajuwon versus -3 defense (very good), 1993 to 1996:
Regular season: 106.8 offensive rating
Playoffs: 113.0 offensive rating
Robinson versus -3 defense(very good), 1993 to 1996:
Regular season: 113.7 offensive rating
Playoffs: 106.7 offensive rating
David Robinson owns the regular season and his advanced stats are superb, but Olajuwon’s offensive rating in the playoffs, adjusted for opposing defenses, matches the Admiral’s regular season dominance.
Since Olajuwon’s offensive efficiency climbs by around 6 points and he uses 30% of their possessions while playing three-quarters of the game, roughly speaking, he improves his own team’s offense by 1.3 points per game. That’s enough to swing a close series when the two teams are even and would explain how the Rockets kept downing higher seeds.
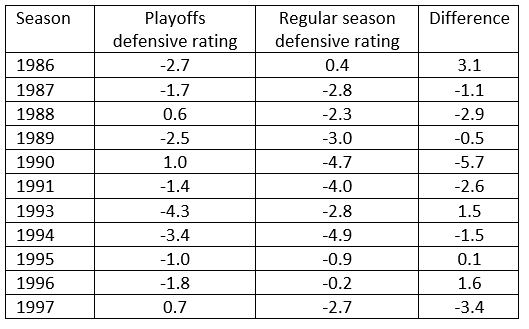
As a last note, we’ve covered Olajuwon’s offensive efficiency in depth, but what about his defense? There’s a law of conservation of energy here, as the universe says there are “no free lunches.” If you improve on offense, is it not reasonable to theorize you lose some effectiveness on defense? Let’s test this by seeing how Houston’s defense does adjusted for the level of competition season by season. (The values are relative to league average, and for reference negative is above average, -3 defenses are typically ranked around 5th, and -7 would be an all-time one.)
Average disparity:
-1.03
Average disparity (weighed by possessions):
-0.33
The 1986 season is a bit of an outlier, as the Rockets more often than not slacked off a little on defense in the post-season. Note that there’s a selection bias here because when your defense underachieves, you’re more likely to be eliminated from the playoffs. The changes are still small, however, and it’s difficult to make definitive conclusions. This is also team defense only, and it could be the case that his teammates were worse; there’s also a possibility Olajuwon got worse but his teammates got better on defense. Another method is to use basketball-reference’s Drtg, which is a fairly poor metric for defense but at least it’s keeping track of rebounds, blocks, and steals.
Using the same method that was done with Olajuwon’s efficiency, his defensive rating (Drtg) is not significantly smaller in the playoffs. There’s a small decrease (roughly 1 point), but there’s too much variation and it pales in comparison to his offensive production. Given the metric’s poor track record at evaluating defense, we’re still lost in the maze, mired in unsubstantiated theories.
Statistics in sports are often about busting myths and revealing reality to be plain. If there’s something transcendent out there, people armed with spreadsheets and databases can swoop in and explain it like a weather balloon in Roswell: this event was not unique as, in fact, there are 52 such players with similar games since the merger. But sometimes specialness survives. Some scientists say their favorite experience is surprise, because that’s when the real learning starts. I don’t know why Olajuwon’s playoff scoring is so much more effective in the playoffs, but it’s there. And it’s a sight to behold.