


In a recent article on Grantland, Kirk Goldsberry argues Kevin Love would be more beneficial for his team if he hung out on the perimeter less and crashed the offensive glass more. Goldsberry has an impressive dataset few can be competitive with and an arsenal of resources at his disposal, including some of the best students in the country, but he’s missing an important detail in his breakdown of Kevin Love: spacing.
In the article, Goldsberry asserts that Love would be better off playing near the basket and crashing the boards, because his team is more likely to recover his shot. He cites Love’s “mostly average” three-point shot as something that doesn’t warrant the attempts he hoists. First of all, as popular as his charts are, you do not get extra credit for being above-average compared to your peers at specific spots on the floor. A mere “league average” three-point shooter is very efficient.
To quote Goldsberry:
This is a case where our simplified obsession with field goal percentage (or points per shot) as a proxy for shooting effectiveness is itself defective. Not all field goal attempts are created equal, and you cannot judge a shot’s worth based solely on its probable point yield.
Hence, a three-point attempt is not the same as a shot inside the paint. They have different effects, and anyone stating otherwise and that the box score is a perfect representation of reality is* looking like a climate change-denier. Two teams that highly value spacing, the San Antonio Spurs and Miami Heat, just squared-off in the finals and have three of the last four titles; the other title went to a team built around a long-range, generation-defining stretch-4.
What the numbers say
The fact offensive rebounds are more likely when Love shoots inside is a true one, but we have to compare this to the added benefit of Love stepping outside the arc. Quantifying this, let’s use an ASPM model (a regression model built off a 14-year RAPM set of player values) that incorporates a variety of factors on offense, including efficiency, shot usage, and rebounding. Love peaked at a 15% offensive rebound rate (snatching 15 percent of all available rebounds on offense) as a rookie and hit a low point of 8.9% last season. The all-time record for offensive rebound rate is a little over 20%, held by Rodman, so let’s be generous and say a crash-happy Love increases his rate by 10%. Based on the ASPM model, this results in a net gain of +1.3 points per 100 possessions for his team solely on rebounding alone.
Correspondingly, Kevin’s three-point attempt rate will dwindle by his focus on rebounds. Let’s say he nearly eliminates the shot from his repertoire by reducing it by 8 attempts per 100 possessions. Based on the ASPM model, which includes the pre-2005 era, the spacing effect with an extra boost for frontcourt players leads to a gain of +2.6 points for his team per 100 possessions. Remember, this is for attempts only, and not efficiency. Spacing is more valuable, especially for big men, than offensive rebounding.
Yet, most big men who shoot are not comparable rebounders. Let’s look at the gain in rebounding when Love shoots inside. According to Goldsberry, Minnesota rebounded 37% of Love’s misses inside 8 feet, and 23% outside of 8 feet. There are no numbers given for offensive efficiency after an offensive rebound — NBAWOWY has effective field-goal percentage after an offensive rebound, and it’s a little lower than Minnesota’s overall average — but let’s be kind and assume free throws are more common and say it’s 1.1 points per possession. Given the 14% increase in likelihood of rebounding, this roughly translates to a 0.15 point boost per possession, with a shot inside 8 feet. Using the ASPM metric, a shot from a power forward from the three-point line, the spacing boost is, again, twice as large: 0.31. (These are not perfect comparisons, however, as the spacing effect is in essence an average over several possessions even without shooting, but it shows the magnitude is competitive.)
Goldsberry also left out a bit of math that helps out three-pointers with regard to rebounding: the lower field-goal percentage on three-pointers, saved by the extra point, also means that there are more opportunities to rebound the ball. Comparing equivalent efficiencies, 60-percent inside and 40-percent outside the line, there’s another 20% of available rebounds to grab. This nearly closes the gap using the 23% and 37% offensive rebound marks: a chance of 14.8% percent of grabbing an offensive rebound from an inside shot, and a chance of 13.8% of grabbing an offensive rebound from an outside shot. Then there’s the issue of turnovers being more rampant inside the paint and on post-ups.
There’s yet another problem: every team knows that the best shot is an attempt at the rim, even teams that love three-pointers. In fact, some teams add three-point shooting to make it easier to shoot inside. It’s also a curious decision to lump in 8-foot shots, dunks and lay-ups. Plays like cuts and missed rotations where Love is open underneath was included with post-up shots, like short jumpers and hooks. Of course, every team would like to have more shots at the rim, but one can’t simply will those into existence. And with LeBron James on the team, it would be better if someone else shot more inside.
Bridging the gap: team wins
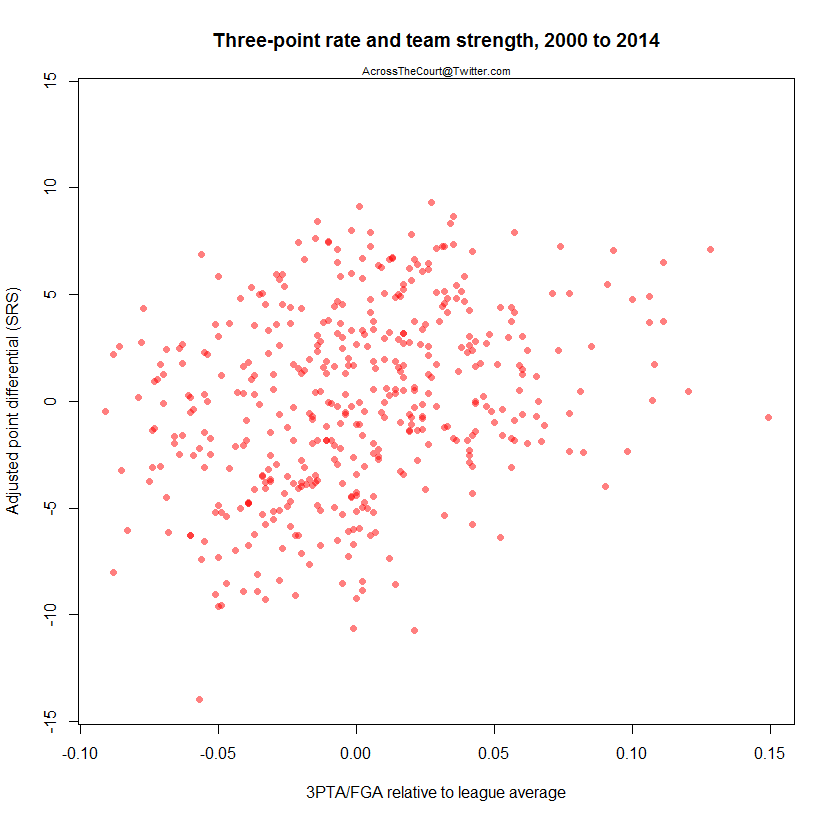
The results are not surprising for those who keep track of the trends of successful teams. Offensive rebounding and team wins have an almost zero correlation. Looking at seasons 2000 through 2014, and the relationship between offensive rebound percentage and adjusted point differential, a good proxy for wins is insignificant. The R^2 is 0.001. R^2 is saying how much of the variation is explained by the given variable, and yes, that’s less than 1%. The correlation for three-point rate — the proportion of field goals that are three-pointers — is sixty times as large. In fact, the coefficient for offensive rebounding is very slightly negative, meaning that better teams crash the glass less.

 Look at our most successful teams today: Miami persuaded Chris Bosh to shoot three’s and plugged him in at center, San Antonio employs a bevy of shooters, including Matt Bonner, and also taught a power forward to shoot three’s in Boris Diaw, and even Oklahoma City has a power forward who’s shooting three’s now when they’re not downsizing with Kevin Durant there.
Of course, team correlations do not necessarily couple with individual correlations of value. In a vacuum, it is better for an offense to have more offensive rebounds. But NBA teams don’t exist in vacuums, and like Goldsberry states, we cannot be obsessed with simple stats. There’s a reason why you don’t want Love in the paint more in Cleveland: as good as an offense is with Love scoring and rebounding inside, it’s simply better with LeBron finishing at the rim. In Goldsberry’s own words, “All players have their defining traits: LeBron James is a freak in the paint.” Love standing at the three-point arc means at least one big man is not camped out in the paint and it clears the lane for LeBron.
It’s no coincidence that Kevin Love’s best season has coincided with his worst offensive rebounding season. For Cleveland, they had better consider that.