


As the sports world is obsessed with the return of Derrick Rose and Kobe Bryant from injuries and LeBron’s new team, a few storylines have gone under the radar. There have only been two or three games for most teams, but a few observations are noteworthy — and we have some new toys from SportVU, the NBA’s optical tracking source for stats.
Nerlens Noel and his debut
Pegged as a number one pick, Nerlens Noel fell several draft spots because of an ACL injury that would knock him out for a year. Cleveland skipped him for Anthony Bennett, who had a season that was actually worse than just sitting out, and Noel fell to the 76ers. Since Philadelphia has mocked the idea of fielding a real basketball team, no one is noticing Noel’s rookie season, but he’s shown that defensive potential that led to his hype. Unlike the flashier Anthony Davis, Noel’s blocks are almost always near the rim, which are more valuable. In the first playlist embedded below, he blocks Larry Sanders, his doppelganger, one-on-one and then blocks the geometrically impossible Giannis on a drive. The second playlist has another set of three blocks showing his quick leaping ability and help defense.
Unfortunately, the 76ers are so undermanned that he’s been forced into taking a heavy offensive burden. He’s worked at the elbows and has been pressed into creating off the drive or taking jump shots. He doesn’t project as a high scorer and should model his offensive game off of Tyson Chandler rolling to the rim or crashing the offensive boards. Ignore his field-goal percentage this season. He’s a good finisher inside and with better teammates (someday) his deficiencies will be masked.
Otto Porter Jr. rebooted
People gave up too quickly on Otto Porter Jr. even though he was a teenager coming off a major injury who couldn’t find minutes on a playoff-bound team pushing for wins. He was labeled a likely bust and critics were eager to find depressing comparisons for him. After a nice preseason, Porter struck success again in the first week of his sophomore season. It’s been only three games, but he’s already had two games with more points than he had in any game last season with the latest being a 21 point outburst on outstanding efficiency. I’ve embeded his field goals from that game below. What’s good news is that he’s an active wing, cutting hard, hitting jumpers on the run, and crashing the glass.
More attention is on number one pick Bennett, but the 2014 draft class is slowly “unbusting” and distancing itself from the catastrophe of the 2000 draft class, traditionally known as the worse ever. For Washington, this is extremely important because they’re fighting for playoff positioning with Beal injured and Webster fighting back problems that ultimately threaten his career while Pierce cannot handle heavy minutes.
Marc Gasol’s bigger role
Following a year marred by an injury, Marc Gasol has slimmed down and started the season with high scoring games that are usually rare for him. He’s average 24.7 points per game through three games so far, and he scored 24 points only once last season. Something different is clearly going on, and it could help revitalize a Grizzly offense that has always been underwhelming. He has a deft touch, but he’a also a great passer and rarely turns the ball over. And he’s just fun to watch on offense with his standstill “jump” shots out of the 1950’s and his old man sweeping hook shot. Fans have embraced him despite their general love of scoring and his lukewarm scoring outputs for his career, topping out at around 14 points a game, so if this trend holds and his scoring rate jumps significantly it’ll be interesting to see how the perception of him changes.
Injury city
The Thunder were decimated with injuries and it wasn’t just because of Durant and Westbrook: other players were out too. Reggie Jackson, in particular, was sorely needed after Westbrook broke his hand. Lamb is out with a strained back. Rookie Jerrett had an ankle surgery, and fellow rookie McGary has a fractured foot. Summer acquisition Morrow has a sprained knee and won’t play for a few weeks. Oklahoma City was left with Telfair, who wasn’t in the league last season, as the sole point guard. Thus, Perry Jones is playing 38 minutes a game and they’re trotting out super-big lineups like Ibaka-Collison-Perkins. Yet it worked, losing to the Clippers by only three points and beating Denver aided by a game from Perkins where he briefly turned into Hakeem Olajuwon. It’s not sustainable, of course, but it speaks to the perseverance of NBA players and how thin the line is between rotation pieces and bench fodder.
Perkins:
Early Christmas gifts from stats.NBA.com and SportVU
Last year we knew we only had the tip of the iceberg when it came to SportVU stats. The underrated stats.NBA.com quietly revamped their site and released an immense amount of stats on every player’s page. If you go to a player’s page and hit the tracking tab you get a comprehensive set of options for shots, rebounds, defense, and assists. The dashboards give you an array of summary types while the logs give you every single shot and rebound, respectively. The logs provide information like game clock, defender, shot distance, etc. The defense tab is wholly intriguing because it’s providing the missing piece in the individual player value puzzle: shot defense. We have rebounds, we have blocks, we have turnover creation from steals, and we have fouls, but we’ve had to indirectly calculate shot defense and somehow credit it to defenders for years.
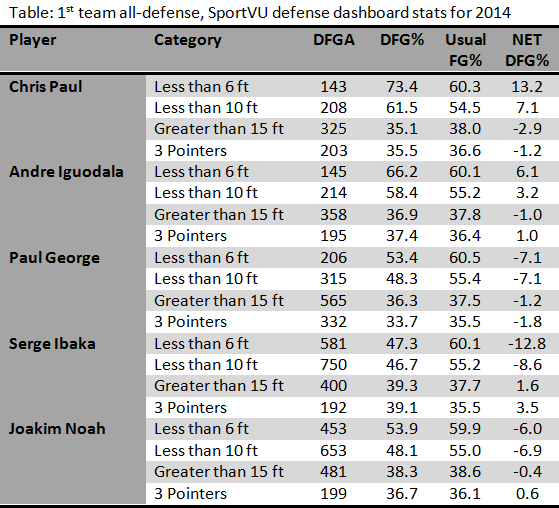
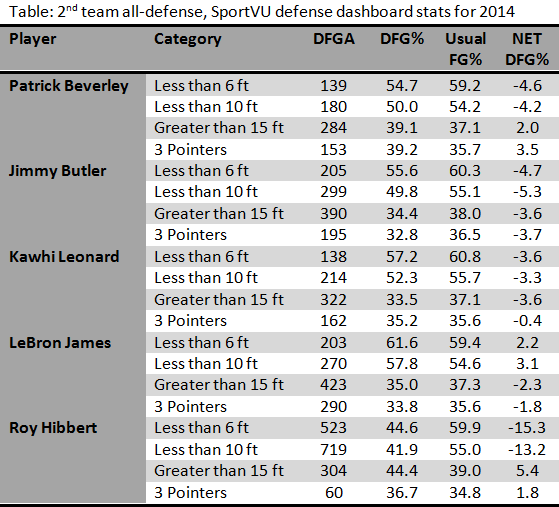
But the defense dashboard is lacking and extremely misleading. Check out Tim Duncan’s tab in 2014. The first column of note is labeled DFGM for opponent field goals where Duncan was the closest defender. Then DFGA is the same but for field goals attempted, and DFG% is the percentage of those shots converted. The FREQ column is straightforward: it’s the proportion of the shot types you’ve defended against. Here’s where we go off the rails. The FG% column is the usual field goal percentage from that opponent for that specific shot zone. The latter point — that it’s only based on zones — is not explicitly explained but it drives the next calculation.
The net FG% is the difference of DFG% and usual FG%. Since FG% is based on the zone, this is misleading. For instance, referencing Duncan for the overall line we see he has a -3.4 difference in FG%, which sounds good but not too impressive. But Duncan more often is guarding shots at the rim, and those shots have a higher field-goal percentage. Thus, if Jimmy Butler tries to make a shot around Tim Duncan, the usual field-goal percentage used for overall is Butler’s overall FG% (40%) and not his percentage at the rim, which is nearly 20 points higher. Opponents near Duncan within 10 feet shot seven percent worse on field goals, which covered two-thirds of the shots Duncan defended. That is more reflective of his defense.
The bottom line is that the “overall” row should basically be ignored, especially for big men. Breaking it up by smaller zones, like inside of 6 feet or outside of 15 feet, is much more informative. Of course, they have a frustrating lack of data here too: there’s 2 pointers, less than 10 feet, more than 15 feet, but nothing to appropriately cover the 10 to 15 foot range. (Some may theorize teams were wary of the public and other teams having any useful data they want to themselves and urged the NBA to release SportVU stats in unusable chunks.)
Nonetheless, one can gleam some interesting stuff. This fills in some of the gaps left by Synergy, and while some will complain about the loss of play types Synergy was notoriously poor with play categorization. Then there’s this immensely useful difference: Synergy gave raw defensive stats, not adjusting for the opponent’s strength, which seems stupid in retrospect. If you look at the smaller zones on the defense tab, they seem to align with reality.
Digging further into the shotlogs
With the release of the complete set of shotlogs for every player that includes the closest defender to every shot, we can bypass those misleading summary stats for defense and build our own. I collected every regular season shot (over 200,000) and with such a deep database the possibilities are rich. But I we have to start with cautions, again, with SportVU: the results are dirty and rife with errors. Below I graphed every shot coded as a three-pointer showing shot distance versus the closest defender. See the problem?
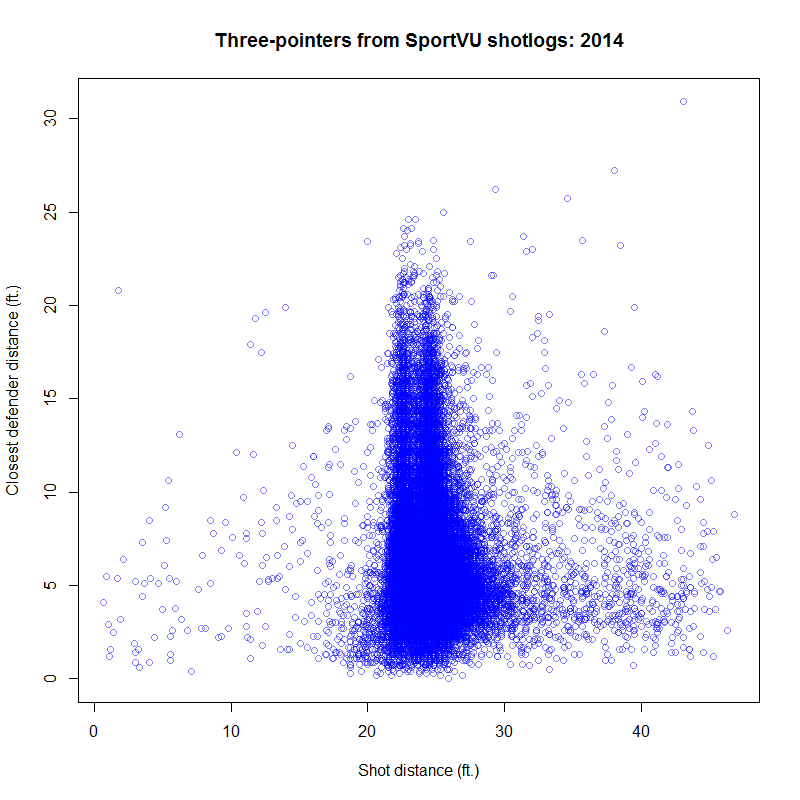
There are over 1600 shots under 22 feet that were called three-pointers including some inside of ten feet. That’s roughly three percent of the total three’s, but they’re perhaps not all errors: most are within a few inches of the corner three-point line. Yet 313 were under 20 feet out of 52,873 coded as three-pointers. This is also a hundred under the total three-pointers taken last season according to basketball-reference, although a few games are missing in the SportVU database.
I isolated a few of these shots and saw different problems but some common threads. Two of the impossible short three-point attempts occurred at the same time as a tipped offensive rebound and the shot was coded as occurring at the time of the tip, including the location of where was shooter was during the tip. Another error happened when Carmelo passed the ball across the court and took a three a few seconds later — the shot was mistakenly identified as being taken at the same time as when he passed. Another error was strange. During a March 26 game, Carmelo clearly took a midrange shot but even the play-by-play files called it a three-pointer, and it was verified by basketball-reference’s play-by-play log and their box score based on the number of attempts they gave him for that game. In that case it could be a scorekeeping error. I’m unaware of how this shotlog data is collected, but it could be working off of play-by-play files and then SportVU tries to identify the shot based on the gameclock in the play-by-play. If the clock is off a couple seconds, then the shot can be wrongly attributed to another action where the ball is close to the rim like a pass or tip. I don’t exactly know how the logs are created, but that’s one theory to explain the errors.
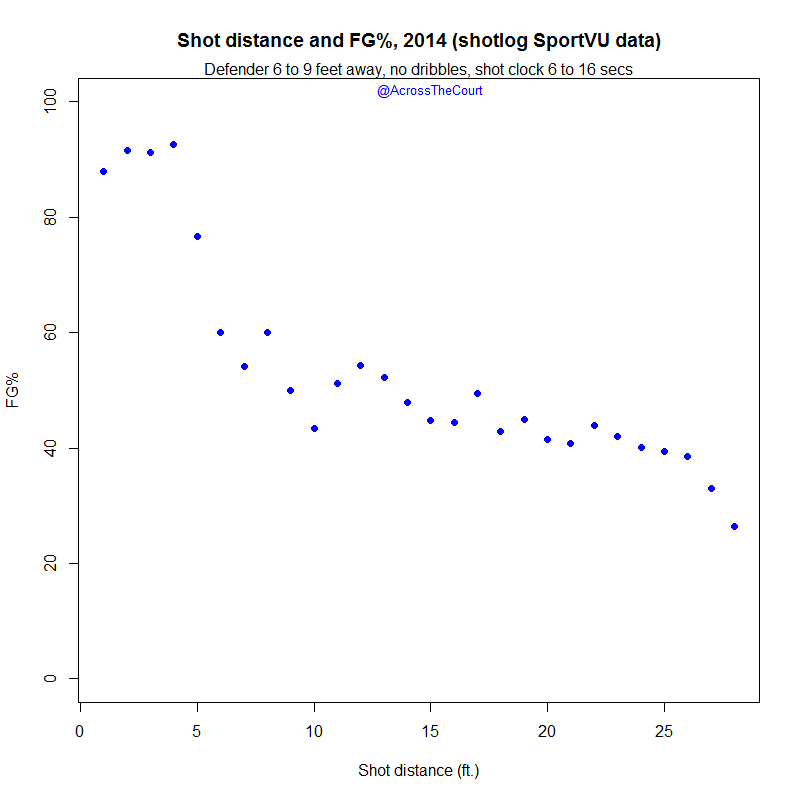
Nonetheless, with so many shots included you can still find patterns and the errors don’t ruin everything. In recent years, shot distance splits have become popular, but we still don’t understand everything (in the public domain) because there are issues like how closely defended the shot was. Controlling for a few factors for a “true” inspection of shot accuracy by distance, I looked at shots that were taken with the shot clock at 6 to 16 seconds, the defender 6 to 9 feet away, and no dribbles taken with one foot increments. The graph has a few interesting takeaways. Within four feet, NBA players often don’t miss, but this rate falls precipitously at five to six feet. There’s also a soft but significant slope from ten feet to a couple past the three-point line. It’s often cited that field-goal percentages are basically the same outside of the paint, but that’s likely a product of shot selection and defense. When a player is lightly contested, a 13 foot shot is a little easier to make than a 23 foot shot — this should be intuitive.
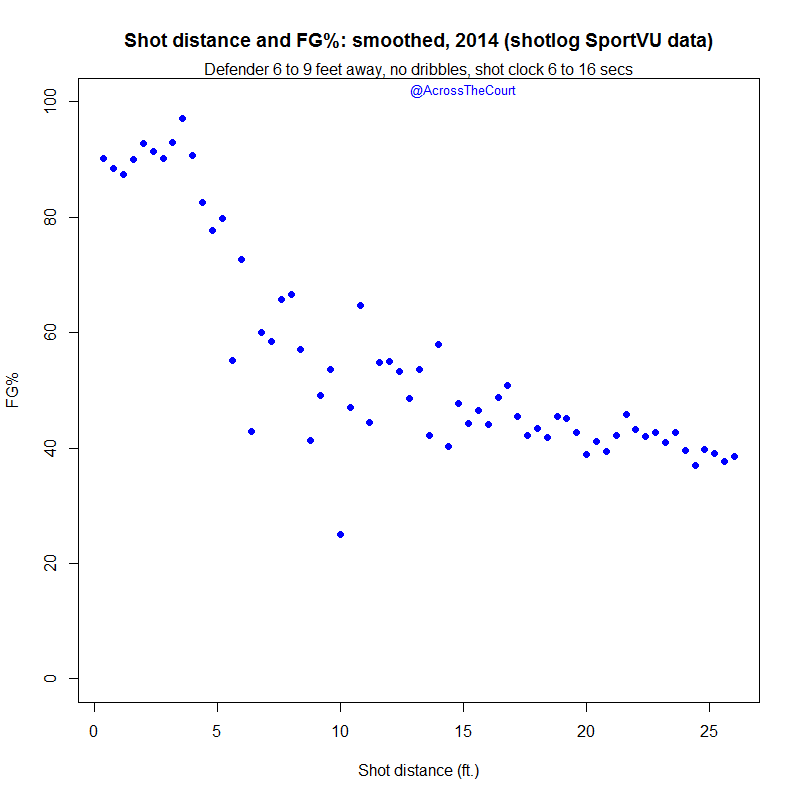
Let’s take smaller slices and then “smooth” the data by taking averages (weighed less) of nearby shots. The trend is still there with the exception of the outlier at ten feet. (There were only a small number of shots at that exact distance and most were misses, skewing the results.) We get a clearer picture of that awkward five to eight foot range. It increases at a pretty steep rate before flatlining.
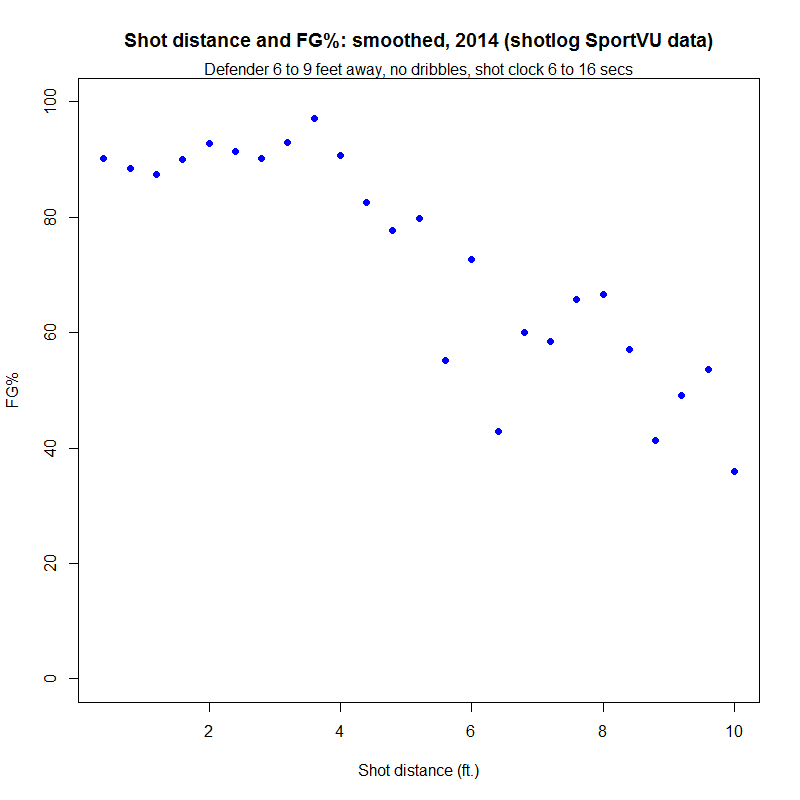
Zooming in for the range inside of ten feet, you can see how field-goal percentage is a constant rate until it hits four feet, and then it drops quickly. Given the length of most arms in the NBA, geometry, and how close shots are taken, this is intuitive. It’s also interesting that the FG% decreases at a linear rate from four feet to ten. From the overall shot zone data we usually have, shots around, say, eight feet look about as difficult as shots at sixteen, but that’s not true if we control the factors that influence accuracy.
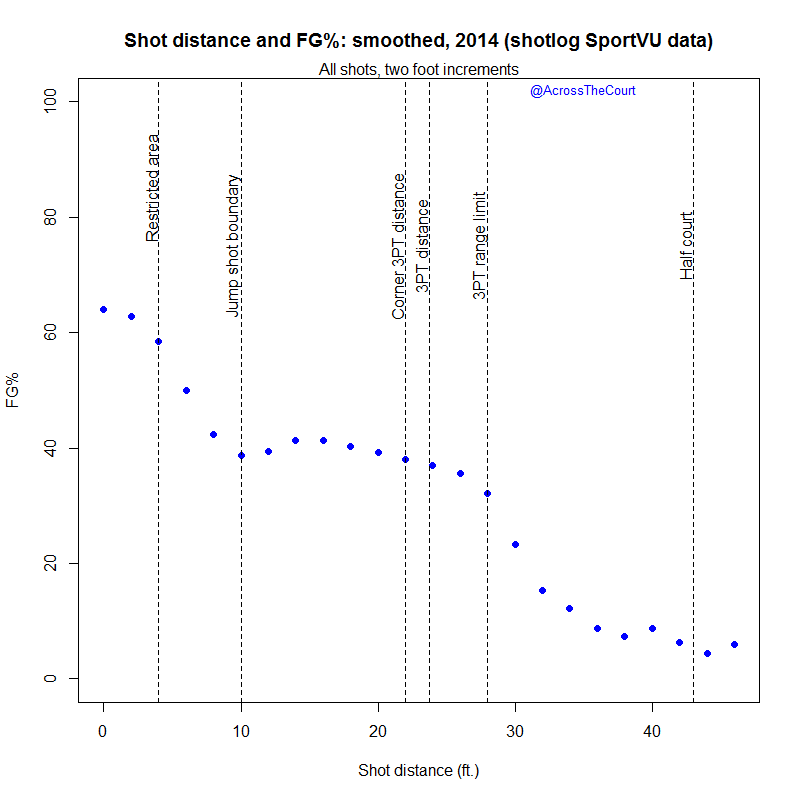
For a clearer picture of FG% at super-long distances, I had to turn off the filters and just include every shot, but some patterns still hold and we get a useful map of NBA shots. The restricted area is the most efficient zone, but then you get that weird area outside to that until you get to ten feet, where percentages stabilize. Ten feet is about the point at which jump shots dominate the shot types. The three-point range limits appears to be at 28 feet, but percentages don’t bottom out until around 37 feet. After that, shots are rare and highly unsuccessful.
You may have noticed there were many controlling factors for shot accuracy. It’s difficult to visualize this, but you can do a basic, exploratory binomial regression model for whether or not a shot is made with variables for how close a defender is, the distance of the shot, the shot clock, and the number of dribbles. Obviously, defense and distance are huge factors, and the shot clock is too since it tracks with fast breaks and rushed heaves, but the number of dribbles is inversely related to FG% in the initial model. (One recent paper found a significant advantage in catch-and-shoot shots compared to shots off the dribble with other factors controlled, so it’s not something to write off entirely.) It’s not properly well-formed with everything considered and there’s no error correction, however, and hopefully in the future I can provide a reasonably good equation to estimate FG% based on significant factors. That can be used to show trade-offs in things like defender distance and what the consequences are with actual numbers, not just a blanket statement about defender distance that provides nothing substantive.
The data’s rough and these are just initial results, but there’s still a lot to mine. I’ll be releasing more results as the season progresses, including a better version of stats for shots defended, a player metric with a better informed defensive component, and a data mine of the rebounds log.